How to Read a Pump Performance Curve
What is a Performance Curve?
A performance curve is a graphical representation of a pump’s hydraulic behavior. It shows the relationship between static pressure and volumetric flow rate. This curve helps engineers understand the pump’s most efficient operating point. Engineers use performance curves to ensure that the selected pump will meet a system’s requirements.
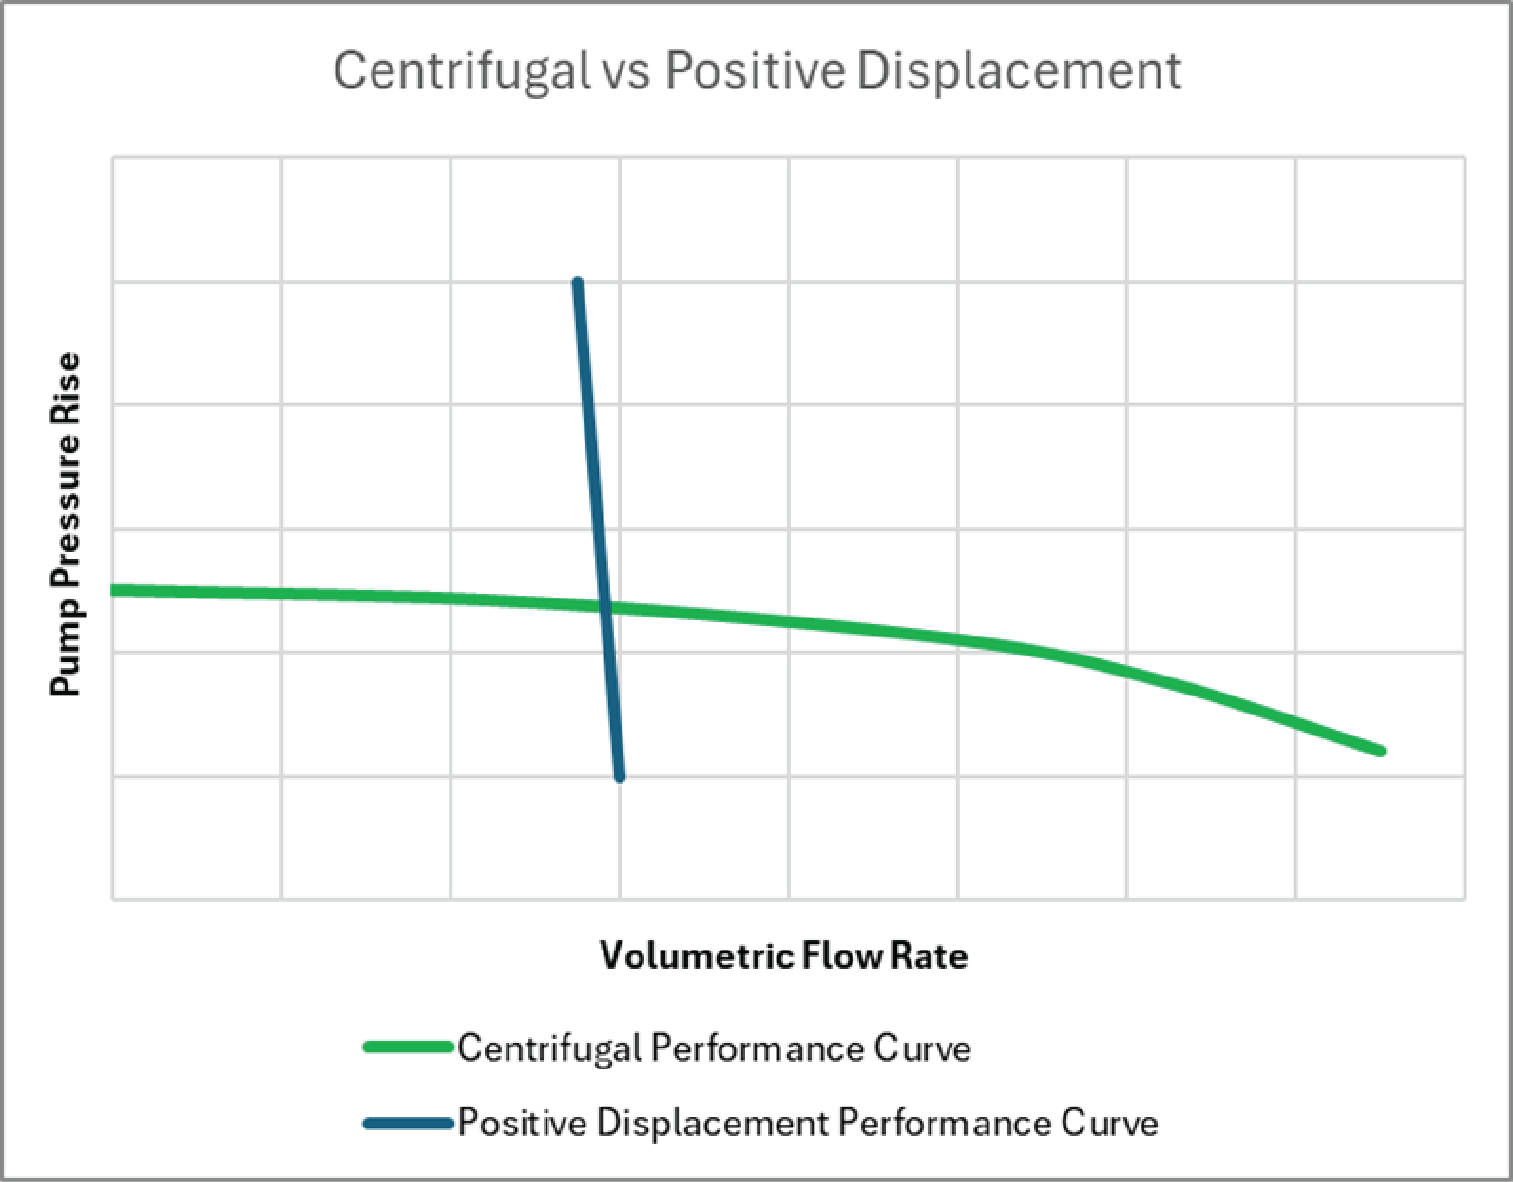
Centrifugal vs Positive Displacement
Centrifugal pumps and positive displacement pumps have very different performance curves. For a given speed, the flow rate of a positive displacement pump is relatively constant regardless of pressure rise. This differs from a centrifugal pump where the flow rate varies significantly with changing pressure rise.
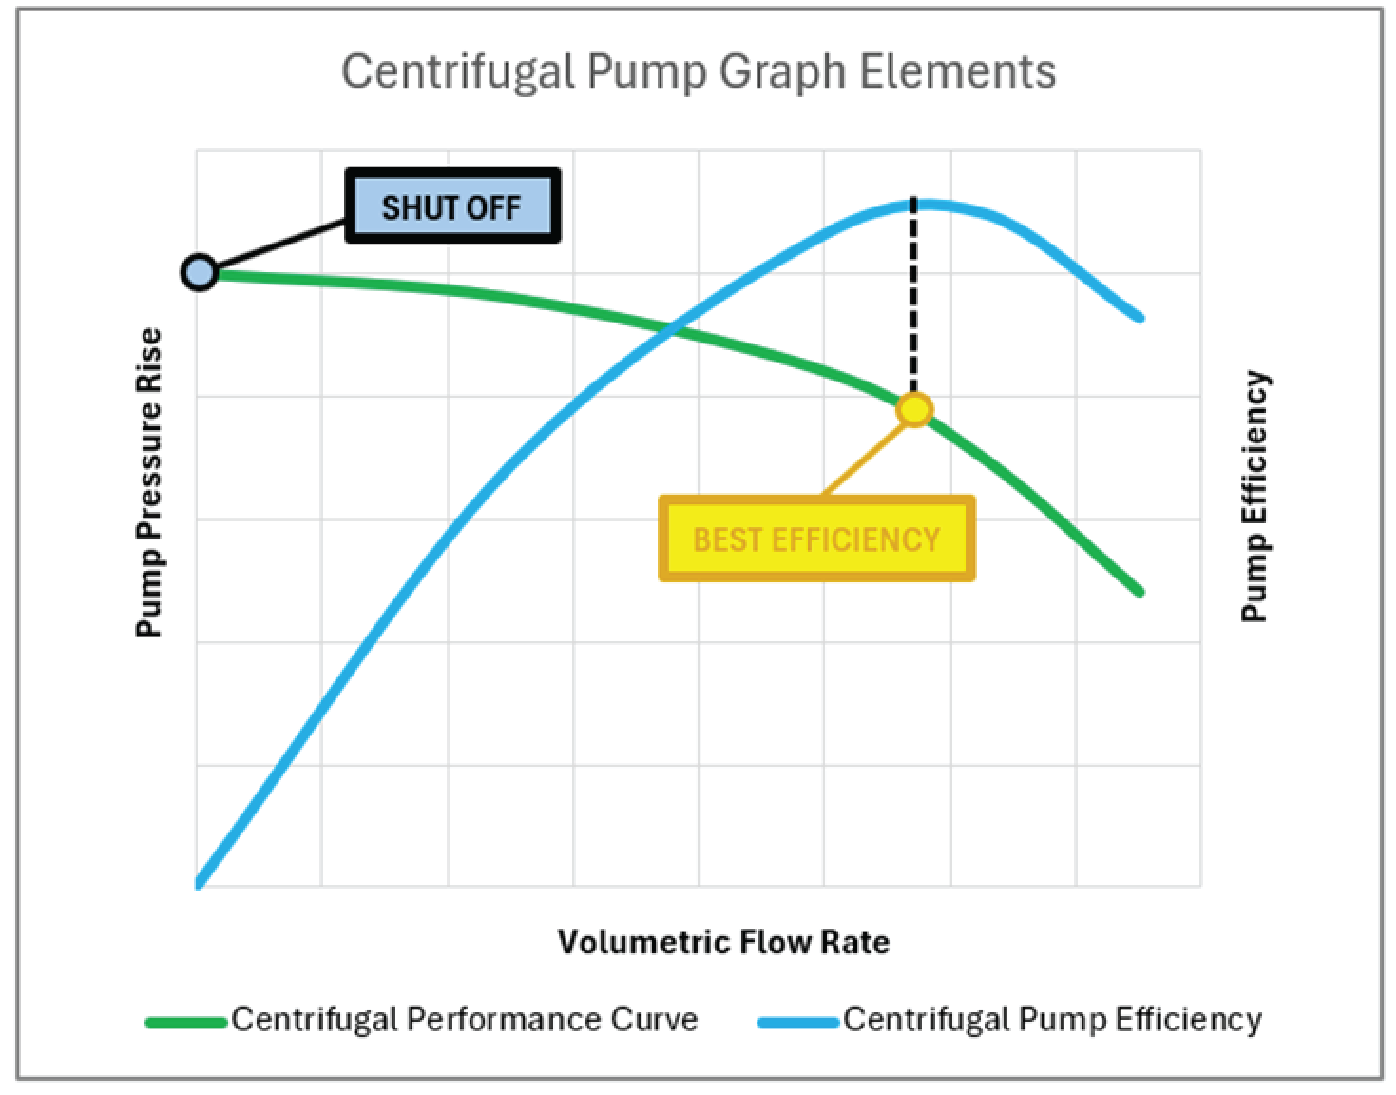
Centrifugal Pump - Understanding the Graph Elements
Best Efficiency Point
The best efficiency point (BEP) is the point on a centrifugal performance curve where the pump has the highest efficiency. Start by finding the peak efficiency of the centrifugal pump. Draw a straight line down to the pump performance curve. The corresponding flow rate and pressure rise of the centrifugal pump at that condition is the BEP. The pump can safely operate to the left and to the right of the BEP, but an optimized pump will be sized to meet performance requirements at or near the BEP.
Shut Off Point
The intersection of the curve at the Y-axis is called the Shut Off point. This point is also sometimes referred to as the pump “dead head”. This is the amount of pressure where the pump will no longer be able to provide flow through the system as it reaches equilibrium. Some pumps can operate continuously at the shut off point. If you have questions about the limitations of specific pumps when operating at the extreme ends of the performance curve, contact AMETEK PDT technical support.
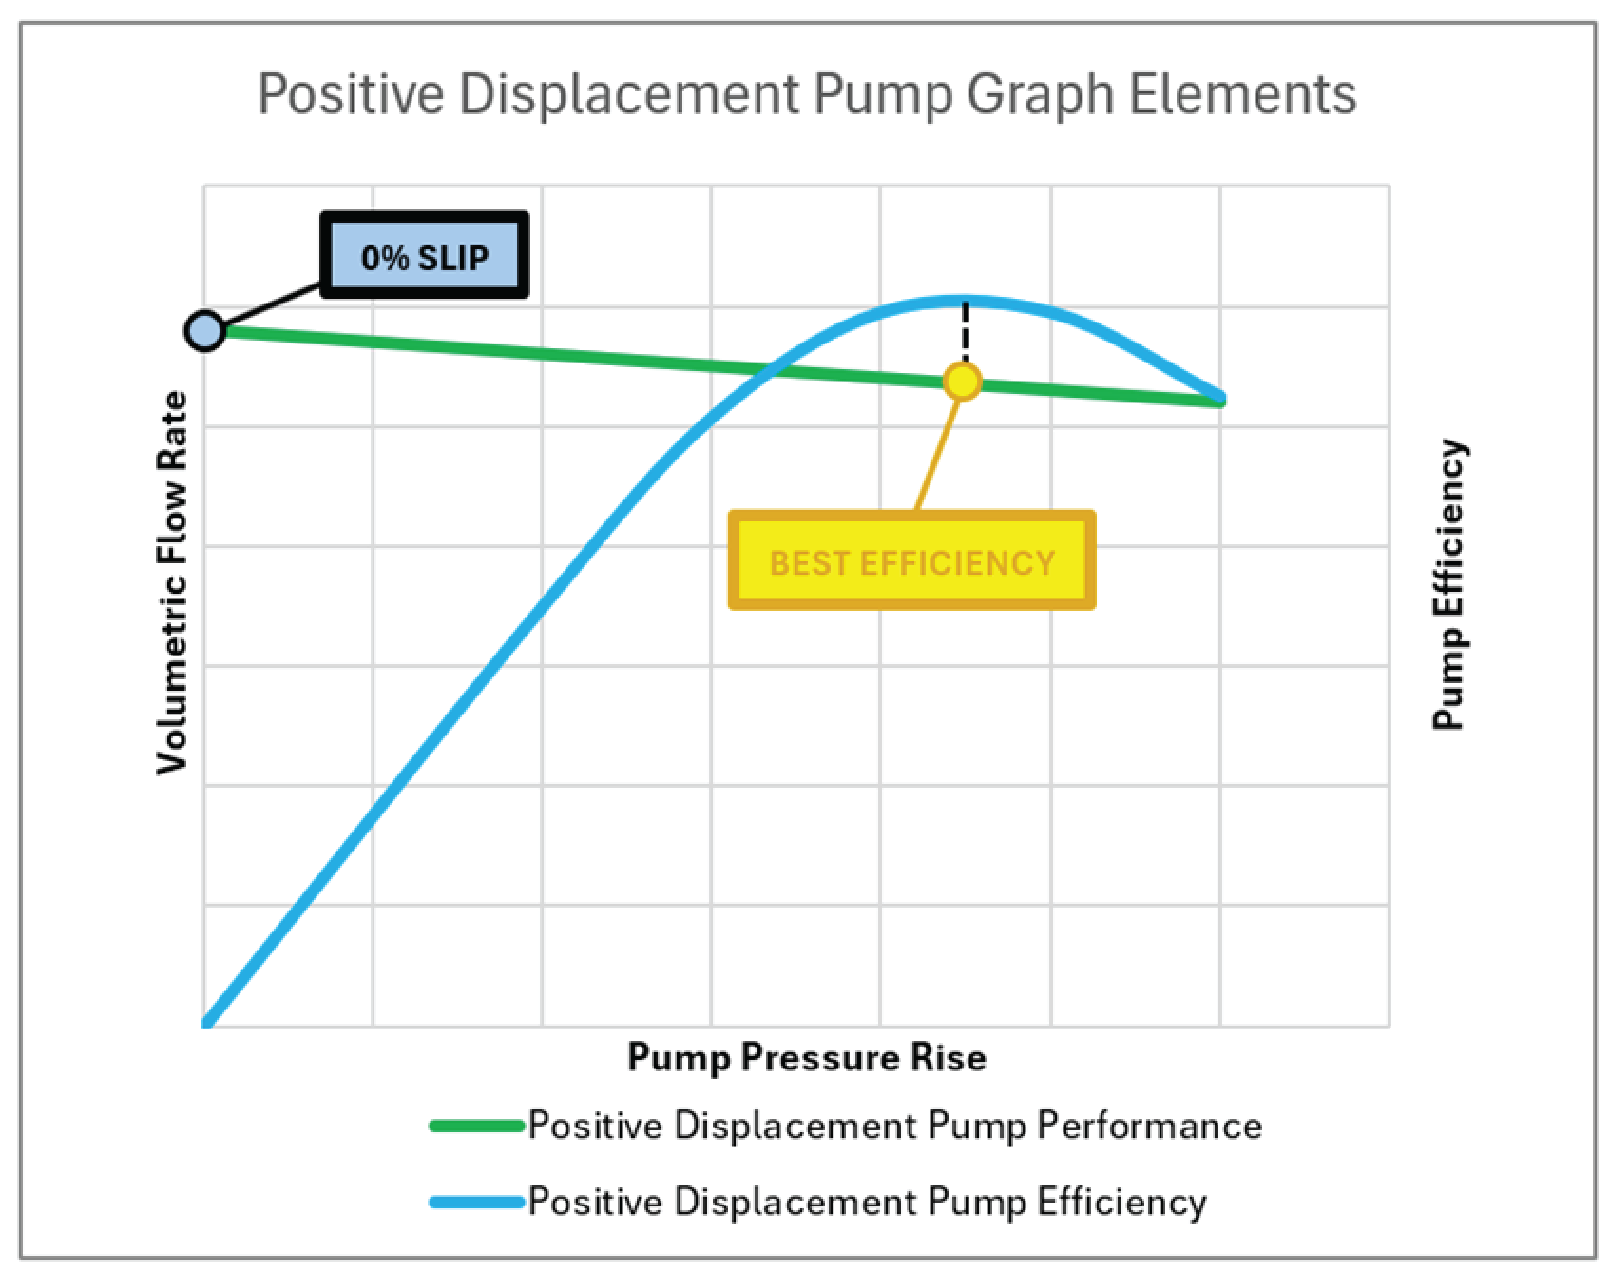
Positive Displacement Pump - Understanding the Graph Elements
The characteristics of a positive displacement pump performance curve vary more with pressure rise than they do with flow rate, so the X and Y primary axes of the plot are often flipped as shown below.
Best Efficiency Point
The best efficiency point (BEP) is the point on a positive displacement pump performance curve where the pump has the highest efficiency. Start by finding the peak efficiency of the pump. Draw a straight line down to the pump performance curve. The corresponding flow rate and pressure rise of the positive displacement pump at that condition is the BEP. The pump can safely operate to the left and to the right of the BEP, but an optimized pump will be sized to meet performance requirements at or near the BEP.
0% SLIP Point
The intersection of the curve at the Y-axis is called the 0% Slip Point. Slip is the amount of flow that internally leaks from outlet of the pump to the inlet of the pump, and it typically increases with increasing pressure rise. For a given operating speed, the 0% slip point represents the maximum flow rate achievable for the positive displacement pump. The 0% slip point is also sometimes referred to as the 100% volumetric efficiency point.
Reading the Graph
Now that you understand the elements of the graph, let’s use it to determine if a pump would work for your application. To begin, plot your performance point on the pump performance curve.
System Impedance
The system impedance is the resistance a system presents to the flow of liquid, which affects the performance of a pump. It encompasses all factors within the system that restrict liquid volumetric flow, such as tubing, heat exchangers, filters, heat loads, valves, or anything else that results in pressure drop when liquid flows through it. System impedance is represented as a curve that shows how resistance increases with volumetric flow. To determine the operating point of a pump in a system, engineers need to know the system's impedance curve.
Find the intersection point of the system impedance curve and the pump’s performance curve. This applies to both centrifugal and positive displacement pumps. This is the actual operating point of the pump when it is installed in your system.

From here, draw a vertical line through the actual operating point until it intersects the power draw or efficiency curve.

Accounting for Other Variables
Keep in mind system features such as filters that may clog over time and change the system impedance. This should be accounted for during the selection process. Plan for the clean and dirty delta P of the filter to ensure the dirty delta P has an actual operating point still results in sufficient flow for your application.
Additionally, liquid properties such as density and viscosity can change the performance of the pump dramatically based on liquid temperature changes.
If you have questions about finding the perfect pump solution for your system, please reach out to our engineering team for assistance.